Pressure-Volume Diagrams

Über den Vortrag
Der Vortrag „Pressure-Volume Diagrams“ von Jared Rovny, PhD ist Bestandteil des Kurses „Thermodynamics and Thermochemistry“.
Quiz zum Vortrag
What is the formula for the amount of work done by the system at constant pressure?
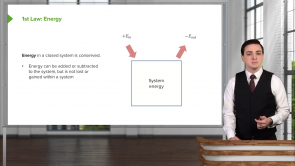
- Amount of work done = pressure x change in volume
- Amount of work done = pressure x change in energy
- Amount of work done = pressure x change in temperature
- Amount of work done = pressure x change in the length of the system
- Amount of work done = change in internal energy
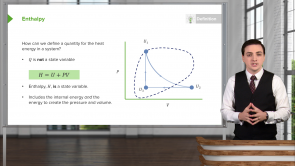
System A undergoes an adiabatic process from volume V₁ and pressure P to volume V₂ > V₁. System B undergoes an isothermal process from volume V₁ and pressure P to volume V₂ > V₁. Which system has done more work and why?
- System B has done more work because in the pressure-volume diagram the curve of system B remains above the curve of system A throughout the process.
- System B has done more work because in the pressure-volume diagram the curve of system B remains below the curve of system A throughout the process.
- System A has done more work because in the pressure-volume diagram the curve of system A remains above the curve of system B throughout the process.
- System A has done more work because in the pressure-volume diagram the curve of system A remains below the curve of system B throughout the process.
- Both have done the same amount of work since the area under their curves in the pressure-volume diagram is the same.
When is a system considered isochoric, isothermal, adiabatic or isobaric?
- Isochoric : volume held constant, isothermal: temperature held constant adiabatic: No heat transfer (Q = 0), isobaric: pressure held constant
- Isochoric : volume held constant, isothermal: No heat transfer (Q = 0) adiabatic: temperature held constant, isobaric: pressure held constant
- Isochoric : pressure held constant, isothermal: temperature held constant adiabatic: No heat transfer (Q = 0), isobaric: volume held constant
- Isochoric : volume held constant, isothermal: temperature held constant adiabatic: pressure held constant, isobaric: No heat transfer (Q = 0)
- Isochoric : volume held constant, isothermal: pressure held constant adiabatic: No heat transfer (Q = 0), isobaric: temperature held constant
The volume of a gas is doubled as its pressure is held constant at 1 atm. If the initial volume of the gas is 1 L, how much work is done by the gas? (1 atm = 100,000 Pa, 1 L = 0.001 m³)
- 100 J
- 200 J
- 50 J
- -200 J
- -100 J
Diese Kurse könnten Sie interessieren


Dozent des Vortrages Pressure-Volume Diagrams

Jared Rovny, PhD
Dr. Jared Rovny has been a Lecturer at Yale University in Connecticut, USA since 2013.
He obtained his PhD in Physics from Yale University in 2019. He was awarded the D. Allan Bromley Graduate Fellowship in Physics in 2019 and the Princeton Quantum Institute Postdoctoral Fellow in 2020.
Currently, he works with Yale's Center for Teaching and Learning at Yale University.
Due to his achievements, he earned the Yale College Prize Teaching Fellowship for his work in PHYS 171 (University Physics for the Life Sciences).
Within Lecturio, Dr. Rovny teaches courses on Physics.
Kundenrezensionen
5,0 von 5 Sternen
| 5 Sterne |
|
5 |
| 4 Sterne |
|
0 |
| 3 Sterne |
|
0 |
| 2 Sterne |
|
0 |
| 1 Stern |
|
0 |
