Playlist
Show Playlist
Hide Playlist
Combination of Cardiac and Vascular Function Curves – Regulation of Venous Pressure

-
Slides RegulationVenousPressure VascularPhysiology.pdf
-
Download Lecture Overview
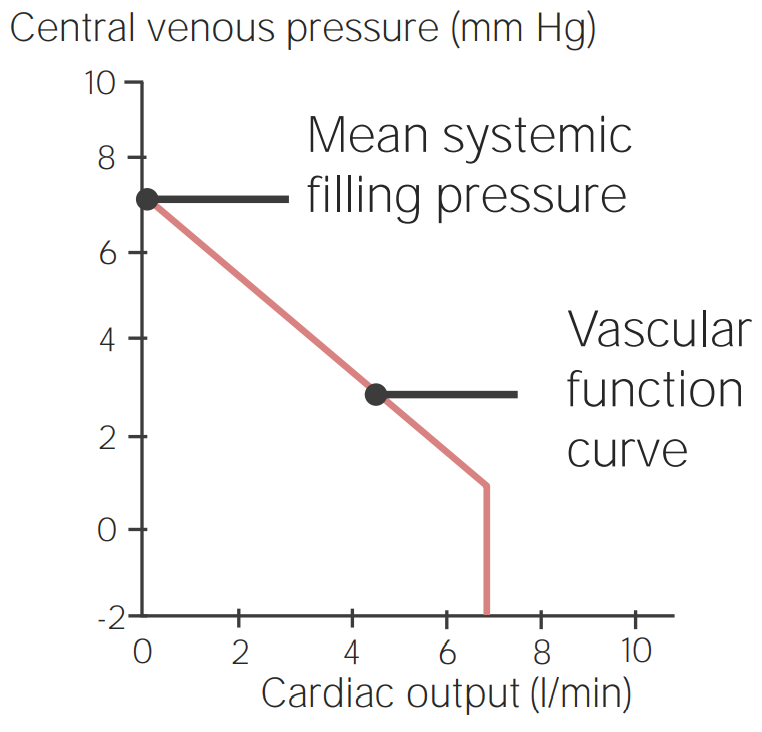
00:00 Now we're going to do some combinations, some integration of some of the aspects we've already discussed. Adding to it, vascular function curves. So cardiac function curves are oftentimes dealt with to things like the Frank-Starling mechanism where you usually plot either central venous pressure or left ventricular and diastolic pressure on the X axis then you plot cardiac output or something like stroke volume on the Y. Here, to make sure that the link happens with vascular function curves, we're going to use central venous pressure plotted against cardiac output. Here we have our traditional vascular function curve flipped a little bit on its head so that we have cardiac output now on the Y axis, rather in vascular function curves we usually put it on the X. So let's trace through this kind of curve. The normal operating point. You usually have a cardiac output of around 5 liters. The central venous pressure that corresponds to 5 liters is about 2 mmHg. Remember that central venous pressure is most of the time between 0 and 4 mmHg. The intersection point here is the most important thing. We're going to call this part here this equilibrium point. Wherever the equilibrium point is is what the body is going to try to adjust. So, let's go through a number of clinical scenarios that might affect either the heart or the vasculature and let's see how the body would want to respond to that with a change in this equilibrium point. Starting with normal, our first condition is a decrease in contractility or inotropy. So this could happen very clinically by something like a heart attack. Someone had a myocardial infarction or a heart attack which decrease their heart's ability to pump, it decreased their inotropy contractility. Now instead of haviing a 5-liter cardiac output, you have a 4-liter cardiac output. That is not enough cardiac output to perfuse all the tissues in the body, therefore some tissues are going to become hypoxic. You can't have that, you need to fix this problem. How is the body going to fix this problem? It may not be able to increase inotropy because of the heart attack so it's possible that you're going to have to try to fix it through another mechanism. This decrease in inotropy associated with a heart attack needs to be fixed. So how is the body going to do that? One way is to volume overload and as you volume overload the heart, you get an increase in blood volume. This increase in blood volume then moves the equilibrium point to a higher central venous pressure. If you have a higher central venous pressure, it can move that up enough so you have cardiac output return to closer to normal. That is a great example of how a vascular function curve change in blood volume can fix a problem with the heart such as a heart attack. 03:58 Let's take another example for this. How about if you had an individual that lost fluid? Maybe through something like a hemorrhage. So if they had a hemorrhage they lost a little bit of fluid but were able to then clot their blood so that they didn't lose any more fluid. Could the heart respond to try to maintain enough cardiac output? With these vascular function curves you can see that occur. So the first thing that happens if we started at the equilibrium point in a normal condition, a decrease in blood volume would have it travel down the curve to a new equilibrium point at a lower blood volume. How do you fix that response? You need to increase contractility or inotropy and you do that by a cardiac function curve change. What happens is the cardiac function curve gets shifted upwards and to the right and that allows to return cardiac output to its normal level. Notice though as you move cardiac output up to this new equilibrium point, that central venous pressure decreases. So you have to always look at both variables, central venous pressure and cardiac output to make sure you understand how the body is trying to respond to either a change in a cardiac curve or a change in a vascular function curve. I invite you to play with these scenarios so that you get a good feel for if you have increases in blood volume, decreases in blood volume, changes in the cardiac function curve of decreasing or increasing and how the body would then try to adapt to such a response.
About the Lecture
The lecture Combination of Cardiac and Vascular Function Curves – Regulation of Venous Pressure by Thad Wilson, PhD is from the course Vascular Physiology.
Included Quiz Questions
Which of the following is the name of the intersection of the vascular function curve and cardiac function curve?
- Equilibrium point
- Breaking point
- Intersection point
- Hemodynamically stable
- Venous return point
How will the body maintain the equilibrium point after a myocardial infarction causing decreased inotropy?
- Increase blood volume
- Increase the force of contraction
- Increase heart rate
- Decrease vascular resistance
- Decrease blood volume
How will the body compensate to maintain the equilibrium point seen on a vascular function curve after a hemorrhage?
- Increase inotropy
- Decrease central venous pressure
- Decrease conduction
- Decrease heart rate
- Vasodilatation of vessels
Author of lecture Combination of Cardiac and Vascular Function Curves – Regulation of Venous Pressure

Thad Wilson, PhD
Customer reviews
5,0 of 5 stars
| 5 Stars |
|
3 |
| 4 Stars |
|
0 |
| 3 Stars |
|
0 |
| 2 Stars |
|
0 |
| 1 Star |
|
0 |
I finally understood this concept! I've reviewed it many times but only until now did i understand
EXCELENT never quite understood these concepts until I saw this amazing video! -Sofia from Mexico
Good lecture but annoying how prof. said IONotropy when it is iNOtropy.
