Playlist
Show Playlist
Hide Playlist
Review of Normal ECG

-
Slides ECG of Myocardial Infarction.pdf
-
Download Lecture Overview
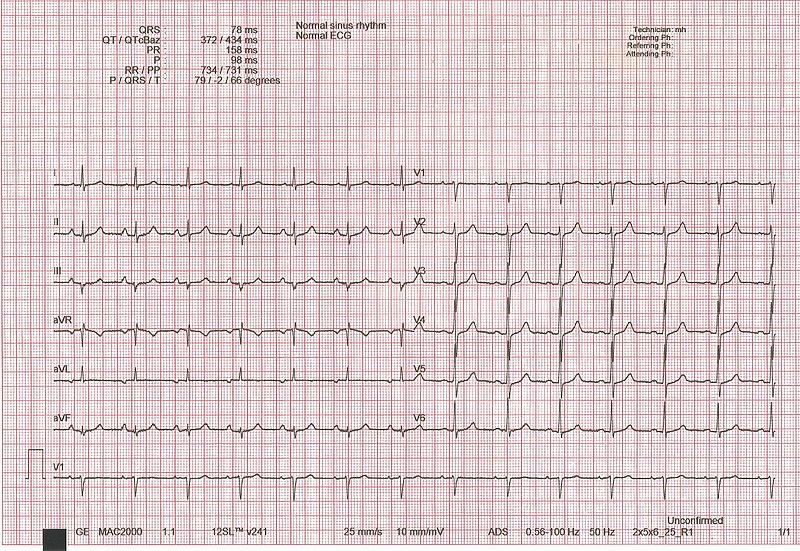
00:01 Hello, I'm Joseph Alpert. 00:03 And in this talk, we are going to go over the EKG changes that occur with myocardial infarction. 00:10 This is one of the most important uses for the electrocardiogram. 00:13 Early recognition of myocardial infarction enables effective therapy for example; reopening a blocked coronary artery to occur which markedly improves the survivability of the patient. 00:26 So again, let's just have a little review. 00:29 Remember that the electrocardiogram shows the electrical depolarization of the heart. 00:35 It's a simple, cheap, easy task often done in offices and hospitals everywhere. 00:40 It's almost always the first cardiac test that's done. 00:44 It's accurate for ischemia and acute myocardial infarction; that is a heart attack. 00:49 It's also quite accurate on ventricular hypertrophy; that is enlargement of the ventricle muscle and also for arrhythmias. 00:57 And remember, there are many nonspecific and non-diagnostic patterns which is why one has to practice a lot to recognize when something on the electrocardiogram doesn't mean anything. 01:07 An acute myocardial infarction is a heart attack. 01:10 It causes changes on the electrocardiogram in the T waves, in the ST segment and with the development of Q waves. 01:19 Q waves that were not present in the normal ECG that developed during a myocardial infarct represent literally holes in the heart. 01:27 That is electrical holes where there's no viable myocardial cells left. Remember this diagram? This is the normal electrocardiographic complex. 01:38 Notice in yellow, the P wave, usually three little boxes are less in duration and then a - then a short segment between the P wave and the QRS. 01:47 The entire yellow and orange section is referred to as the PR segment on the electrocardiogram. 01:53 In gray, the QRS complex; that's ventricular depolarization. 01:58 Then we have an ST segment that's usually flat, followed by a T wave which is the repolarization wave of the heart as it resets itself for the next beat. 02:07 And the U wave sometimes occurs very often in patients with low blood potassium. 02:13 Here is a normal sinus rhythm. Notice, we've talked about this in earlier slides and in earlier lectures. 02:21 The P wave comes just before the QRS and it is less than five little boxes from the beginning of the P wave to the beginning of the QRS. 02:31 And these are normal ECG complexes, nice narrow QRS. 02:35 And you've seen this normal ECG before. 02:40 This is somebody with nice, normal progression of the R waves across the precordium from almost a tiny R wave in lead V1 to a dominant R wave in V4, 5 and 6 as it goes over the left ventricle. 02:55 And also, the axis is normal with the maximum R wave in lead II. 03:00 And the T waves are all up right, it's a nice, normal ECG.
About the Lecture
The lecture Review of Normal ECG by Joseph Alpert, MD is from the course Electrocardiogram (ECG) Interpretation.
Included Quiz Questions
A Q wave that develops in an ECG during an MI represents which of the following?
- Regions of infarcted myocardial tissue
- Depolarization of the atrium
- Depolarization of the ventricle
- Regions of excitable tissue
- Repolarization of the heart
Which of the following indicates the proper order of the waves in an electrocardiogram?
- P wave → PR segment → QRS complex → ST segment → T wave
- QRS complex → P wave → PR segment → ST segment → T wave
- T wave → TR segment → QRS complex → SP segment → U wave
- P wave → PR segment → QRS complex → U wave → T wave
- P wave → PR segment → T wave → U wave → QRS segment
Author of lecture Review of Normal ECG

Joseph Alpert, MD
Customer reviews
5,0 of 5 stars
| 5 Stars |
|
5 |
| 4 Stars |
|
0 |
| 3 Stars |
|
0 |
| 2 Stars |
|
0 |
| 1 Star |
|
0 |
