Playlist
Show Playlist
Hide Playlist
Power ECG Case Session

-
Slides How to Read an ECG Conclusion.pdf
-
Download Lecture Overview
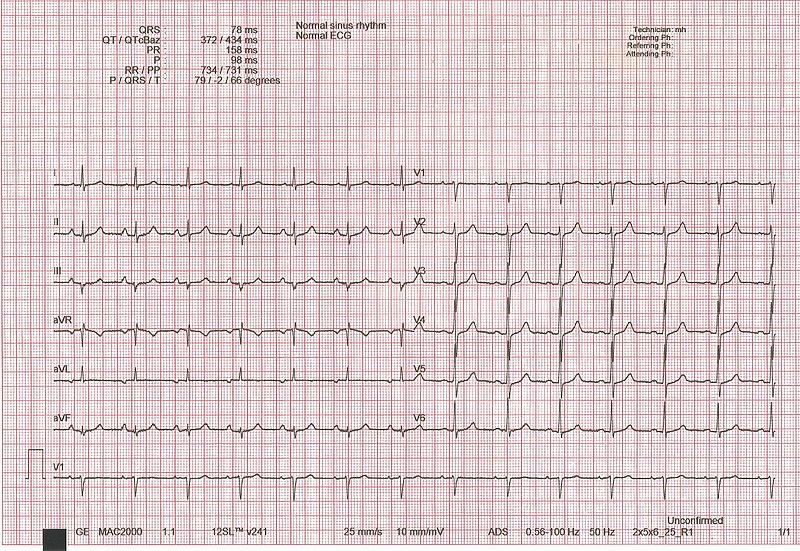
00:01 Now, I’m gonna give you a number of unknown ECGs, let’s see how many of these you can read correctly. 00:07 Again, pause the program with each ECG before you go on to see the answer and see how well you did. 00:15 Here is the first ECG. 00:18 Take your time, look at it, decide what’s the rhythm and are there abnormal complexes of size and so forth, are there arrhythmias and so forth, take your time. 00:36 This is a normal ECG. There’s a P wave in front of each QRS. The QRSs are nice and narrow, the T waves are upright in all the appropriate places. 00:46 You’ll notice that the R wave progression, that is the increase in the R wave across the precordium, it’s perfectly normal. 00:52 Even in V3 and then, V4, already, the R wave dominates and there’s not a big R wave in V1 and the axis is normal. 01:01 The axis is approximately plus 60, somewhere in that range, normal ECG. What do you see in this ECG? This ECG is an acute anterior wall myocardial infarction. 01:22 Notice that there’s ST elevation in leads V1, V2, V3, and aVL and there are Q waves in leads V2, V3, and aVL. 01:34 So, this is an acute anterior wall myocardial infarction, usually, due to obstruction of the left anterior descending coronary artery and the treatment of course is angioplasty to reopen the left anterior descending coronary artery. 01:50 How about this ECG? This ECG shows an inferior wall myocardial infarction. 02:03 Notice in the green box, there’s a little bit of ST segment elevation in leads two, three, and aVF and there are Q waves in two, three, and aVF. 02:13 This may be an older inferior myocardial infarct. Often, the computer will read this as age indetermined. 02:21 There’s not as much ST elevation as you normally see if it were acute. 02:25 So, this may be anywhere from days to months old and of course, they’re abnormally inverted T waves in V3 through V6 and aVF suggesting that there’s some lateral amount as well of involvement of the lateral wall. 02:44 You’ll notice also out in leads - in the anterior leads V4, five and six, there’s Q waves, a little tiny Q wave in V3. 02:52 That also suggests that this is inferior and lateral possibly due to an inclusion of the left circumflex artery. 03:00 So, as mentioned, Q waves and the V leads imply the MI was not just on the back of the heart but also involves the anterolateral part of the heart. 03:10 And that would be often the circumflex artery which supplies some part of the anterior wall and often, the lateral as well, and possibly, inferior back of the heart. 03:20 In 10% of people, much of the back of the heart is supplied by the circumflex coronary artery. 03:26 How about this one? Did you see the ST elevation in all the leads? So, this is not an acute MI, this is pericarditis. 03:42 You’ll note that there’s no reciprocal changes, there’s no ST segment depression in opposite leads. 03:48 So, this is not an ST elevation MI, a STEMI, this is pericarditis. Almost all the leads have ST elevation. 03:56 So, if it were an acute MI, you shouldn’t see ST elevation except in regional zones two, three, and aVF, or the anterior precordial leads. 04:06 You shouldn’t see it in all the leads as here. This is pericarditis. 04:10 The lecture on myocardial infarction gave you an example of a case with a young man who developed pleuritic chest pain. 04:18 That is pain anteriorly that was worse every time he took a deep breath and he had pericarditis. 04:24 What do you see in this ECG? This ECG shows very high voltage in lead one and in actually in lead three, quite deep S waves and lots of voltage in the precordial leads and abnormal T waves and the diagnosis here is LVH with ST-T wave changes. 04:53 This might be somebody with longstanding hypertension. 04:56 This could be somebody for example, with aortic stenosis. 05:00 Notice there are also P waves that are inverted, so, this is left atrial enlargement and that often goes along with left ventricular hypertrophy, the hypertrophy ventricle has high filling pressures and that results in left atrial dilation or hypertrophy. What about this ECG? Did you see the tall, pointed R waves and the tall P waves? So, notice, there’s a tall R wave in lead one. 05:44 Normally, we don’t see a high R wave in V1 and you’ll notice the P waves are very big and pointed. 05:52 So, they’re right atrial enlargement and the fact that there’s a large R wave in lead V1 that’s over the right ventricle, remember, that’s over here, over the right sternal border where we see a lot of right ventricular activity? So, when we see a big tall R wave in V1, it suggests right ventricular hypertrophy. 06:13 Normally, remember, you might see a little tiny R wave in V1 but a predominant S wave. 06:19 And again, these P waves are very suggestive of so-called P pulmonale or P of lung disease pulmonary hypertension with right atrial enlargement. 06:32 You’ll also notice the axis here is very abnormal. 06:35 The maximum R wave is in lead three, that’s plus 120 degrees. 06:39 So, this is a very typical ECG of right ventricular hypertrophy. 06:43 Right axis deviation, P pulmonale or right atrial enlargement and a large R wave in V1. 06:52 Right ventricular hypertrophy, patient with pulmonary hypertension from lung disease, patient with primary pulmonary hypertension, patient with pulmonic stenosis, all of them could do this. 07:05 What’s this ECG? Did you see the rabbit ears in V1, V2, and the wide QRS? This is right bundle branch block. 07:22 You’ll notice also in lead one, there’s a late deep S wave and also, in lead V6. 07:30 But the most impressive thing are the rabbit ears in V1 and V2 and the fact that the QRS is wider than 0.12. 07:39 That is three little boxes. So, this is right bundle branch block. What’s this one? Did you notice the very wide QRS upright in lead one and also upright in V6? The QRS duration is 0.14, so, this is a bundle branch block, no rabbit ears, this is left bundle branch block. 08:07 Notice the bizarre QRSs in V1, V2, and V3, big wide deep S waves, left bundle branch block. 08:17 What about this ECG? Do you see the group beating in this ECG with increasing PR interval? This is type 1 second-degree AV block, so called Wenckebach Block, often benign, can be seen in young athletes. 08:40 And you see the drop QRS? Increasing PR interval and a drop QRS. 08:46 So, you had one, two, three, four P waves, and then, the fifth one’s missing. What about this ECG? Here, you see a very slow heartrate, probably, somewhere in the upper 30’s, a wide QRS, and there’s no regular relationship between the P waves and the QRSs. 09:17 This is third-degree complete heart block. 09:20 This patient had probably had a low blood pressure and needs a permanent pacemaker. What about this ECG? So, this is a trick ECG. Look at the P waves and notice how close they are to the QRS. 09:49 This is the so called Wolff-Parkinson-White Syndrome, WPW. 09:54 This is due to an abnormal connection between the atria and the ventricle. 10:01 So that impulses can get into the ventricle not just through the AV node but through a so-called bypass tract. 10:07 The characteristics are first of all, there’s an elongated QRS with an up-sloping wave to start with called a delta wave and you can see that again in leads V5 and V6 as well. 10:20 The up, that sloping up a wave. 10:23 That’s because there’s slow conduction because of early arrival of the impulse through the bypass tract and the ventricle and it doesn’t perceive normally cuz it’s not using the His-Purkinje System. 10:35 And the short PR interval, that’s because the bypass tract is not slowing down the impulse. 10:43 It’s getting early into the ventricle and these patients can have supraventricular arrhythmias and these individuals can have ablation by the cardiac electrophysiologist and can be cured. 10:55 What’s in this ECG? This is atrial flutter. Did you see the sawtoothing pattern? This is three to one and four to one block with the sawtoothing. 11:15 Clearly, regular rhythm cuz of a circus movement in the atria causing the sawtoothing pattern. 11:23 It’s four to one block, the heartrate, 75 per minute and the wide QRS suggests a slightly abnormal conduction on atypical left bundle cuz the QRS is wide. 11:37 That has nothing to do with the atrial flutter. The atrial flutter is completely separate. 11:42 This patient had left bundle beforehand. What about in this rhythm strip? Did you see how irregularly irregular it is and no sawtoothing? So, this is atrial fibrillation. 12:01 Notice the different widths of the green boxes. 12:04 It’s completely random ventricular activation by the atrial fibrillation impulses getting through the AV node. 12:12 What about this ECG? Did you notice the double impulses before each beat? There are two spikes. 12:28 One for the atrium and one for the ventricle. 12:31 This is a DDD or atrial and ventricular dual chamber pacemaker. Notice the two spikes before the QRS. 12:39 The first spike is the atrial activation, the second spike is the ventricular activation. How about this one? Did you notice it started with ventricular tachycardia and deteriorated into ventricular fibrillation or cardiac arrest? The treatment here is electric shock, defibrillation to get the patient back to sinus rhythm. 13:08 This is a cardiac arrest occurring right in this rhythm strip. How about this one? This is ventricular tachycardia at a heartrate of 140 to 150. There are no P waves. 13:29 There are broad QRSs and the rate is very regular. So, this is ventricular tachycardia. 13:36 This patient would be in distress but might still have a blood pressure. And how about this ECG? This is of course hyperkalemia. Notice the pointed T waves, you wouldn’t wanna sit on them and the serum potassium in this patient was 6.9 milligrams percent. 14:03 What do you see in this ECG? This ECG has nonspecific ST-T wave changes. 14:16 Notice the sort of funny looking slightly depressed ST segment in blue and the abnormal T wave coming out of that ST segment in green and this could be the result of electrolyte abnormality such as hypokalemia. 14:34 It could be hypoxia, infections, a whole variety of things can do this. It’s non-specific EKG changes. 14:41 It doesn’t enable you to make a definitive diagnosis of what caused this. 14:46 And that brings us to the end of the ECG lecture series. 14:50 I hope you’ve enjoyed it and I hope you’ll review it again and practice your ECG reading in the future.
About the Lecture
The lecture Power ECG Case Session by Joseph Alpert, MD is from the course Electrocardiogram (ECG) Interpretation.
Included Quiz Questions
Which of the following is the most likely diagnosis for a patient with an insignificant past medical history who has ST-segment elevation in leads V1, V2, and V3?
- Anterior wall MI
- Inferior wall MI
- Acute pericarditis
- Pseudoaneurysm
- True ventricular aneurysm
Which of the following would be the best next step in the management of an asymptomatic patient with significant Q waves in leads II, III, and aVF of their ECG?
- Outpatient preventive therapy
- No further management
- Fibrinolytic therapy
- Percutaneous coronary intervention
- Coronary artery bypass grafting
Which of the following symptoms is a patient with diffuse ST-segment elevation most likely to experience?
- Pleuritic chest pain that is worse when lying flat
- Severe tearing chest pain radiating to the back
- Acute chest pain radiating to the jaw
- Dysphagia with nonexertional chest pain
- Persistent chest pain that is reproducible with palpation
Which of the following comorbidities is most likely to be detected in a patient with high-voltage QRS complexes in leads I and V1–V6?
- Hypertension
- Pulmonic stenosis
- Diabetes mellitus
- Obesity
- Chronic kidney disease
Which of the following comorbidities is most likely to be detected in a patient with tall R waves in V1 and tall P waves?
- Pulmonary arterial hypertension
- Hypertension
- Aortic stenosis
- Chronic kidney disease
- Aortic regurgitation
Which of the following is the most likely diagnosis for a patient with wide, 'rabbit ear' QRS complexes in leads V1 and V2?
- RBBB
- LBBB
- Anterior wall MI
- Inferior wall MI
- Premature ventricular complexes
Which of the following is the most likely diagnosis for a patient with gradually increasing PR intervals leading to a missing QRS?
- 2nd-degree AV block
- Wolff-Parkinson-White syndrome
- Lown-Ganong-Levine syndrome
- 1st-degree AV block
- 3rd-degree AV block
A patient is diagnosed with Wolff-Parkinson-White syndrome. Which of the following was most likely present on his ECG?
- QRS prolongation greater than 0.12 s
- PR interval prolongation greater than 0.2 s
- QTc interval greater than 0.44 s
- Presence of U waves
- Presence of peaked T waves
A patient is diagnosed with atrial flutter. Which of the following was most likely present on his ECG?
- Sawtooth wave pattern
- Wide QRS complexes
- Bradycardia
- Peaked T waves
- Undulating baseline
A patient is diagnosed with ventricular tachycardia. Apart from wide QRS complexes, which of the following was most likely noted on his ECG?
- Absence of P waves
- Long QT interval
- Bradycardia
- ST-segment elevation
- ST-segment depression
Author of lecture Power ECG Case Session

Joseph Alpert, MD
Customer reviews
5,0 of 5 stars
| 5 Stars |
|
2 |
| 4 Stars |
|
0 |
| 3 Stars |
|
0 |
| 2 Stars |
|
0 |
| 1 Star |
|
0 |
The ECG lectures, including this Case Session, are excellent. Thank you, Dr Alpert, for sharing your experiences and expertise.
This rating is not just for this specific lecture but for the ECG series. The lecturer is very passionate, he's an inspiration, a library as we would say in Africa culture. I would recommend to any medical student
