Playlist
Show Playlist
Hide Playlist
Abnormal T Waves: Differentiating Pericarditis from Myocardial Infarction (MI)

-
Slides ECG of Myocardial Infarction.pdf
-
Download Lecture Overview
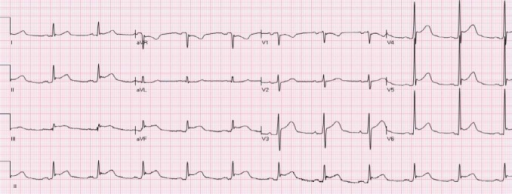
00:01 So, just to take a look at what happens to T-wave changes with time. 00:06 When there's an acute infarct, notice the first complex is normal. 00:11 See? Nice upright T-wave. 00:14 As the infarct first starts if you're lucky enough to see the patient within the first few minutes cuz they happen to be coming into the office or visiting the hospital when they started to have chest pain, the T-wave can go up and can become quite large compared to its baseline. 00:29 Then ST elevation develops. 00:32 Then in the next one, you get some T-wave inversion and notice also that the Q wave has developed now in the fourth complex. 00:40 In the fifth complex as time goes on, the Q wave remains but the ST elevation improves. 00:47 And then finally well out, the T-wave is normalized but notice, the Q wave has not gone away. 00:54 The electric hole in the heart remains. 00:56 There's a scar in the heart that shows you there was a previous myocardial infarct. 01:01 ST segment elevation, may persist for a number of days after an acute MI and the T-wave inversion may persist for a long time even years. 01:12 Although usually they normalized within a year or so, but the Q waves may persist forever. 01:18 If the patient develops a new right or left bundle branch block after an MI, it's a large MI and has a poor prognosis. 01:25 So we haven't talked about bundle branch blocks yet that's gonna be a whole lecture on to itself. 01:30 It's when there's an injury to the bundles down in the ventricle; the electrical conduction bundles, the right and the left bundle. 01:38 When there's injury to that, it usually implies a very large heart attack and has a very bad prognosis. 01:44 And if there's ST elevation in more than one zone, for example you're seeing both anterior and inferior, you have to think, "Oh, maybe this is not a heart attack at all. This could be pericarditis." And I'm gonna show you an example where there's ST elevation throughout the EKG. 01:59 And the real thing that's going on here is pericarditis, it's not an acute MI. 02:04 By the way, don't use monitor leads to look at the ST segment because they change with the patient's position. 02:11 So you can mimic ST elevation by rolling around in bed, so don't worry about monitor leads showing ST elevation or ST depression. 02:21 So, let's talk about pericarditis. Here's an example. 02:27 Notice there's diffused ST segment elevation and there's no reciprocal changes. 02:32 Remember the mirror image changes are not here. 02:35 There's ST elevation in lead I, lead II, lead III, also in aVF, also in V2, V3, V4, 5 and 6. 02:45 So there's diffused ST segment elevation. What's the conclusion? This is not an ST elevation MI, this is pericarditis. And usually the clinical story will tell you too. 02:56 The patient with an MI, when they take a deep breath, the pain doesn't get worse. 03:01 When the patient has pericarditis, the pain gets worse. 03:04 And also, pericarditis can occur in young people who are not at risk for heart attack. 03:09 They don't have risk factors for atherosclerosis. 03:12 Computer EKG, I have to emphasize again, is not perfectly accurate. 03:18 It has to be overread by an experienced electrocardiography. 03:22 And what's the best way to become an expert at reading EKGs? Practice. It's just like a musical instrument, you'll get better with time. 03:31 Now, let's talk a little bit about the immediate changes in the T waves that can occur which are not an acute MI. 03:39 So, normal T waves as you know are upright in leads V3 through V6 and also upright in lead I and II. 03:47 They're usually inverted in aVR cuz remember aVR is looking from way up here on the right arm. 03:52 And they can be variable in other leads. If they're inverted, consider a number of things. 03:59 First of all, some normals can have inverted T waves. 04:03 It may mean nothing in a perfectly young and healthy person. 04:06 On the other hand, ischemia or a non-ST elevation MI, we've already talked about, can invert the T waves. 04:14 Certain hypertrophy patterns that is patients with left ventricular hypertrophy from aortic stenosis or long-standing hypertension or hypertrophic cardiomyopathy can have deeply inverted T waves and usually very tall R waves telling you there's lots of heart muscle there. 04:32 We're gonna have a whole lecture on hypertrophy patterns. 04:36 Interestingly enough, stroke can cause an inversion of the T waves and usually markedly prolongs the QT interval as well. 04:44 It's thought to be due to damages or pressure on the autonomic nervous system due to the stroke. 04:52 And of course metabolic abnormalities, hypokalemia, hyponatremia, acidosis, hypoxemia, all of these can cause T wave inversions.
About the Lecture
The lecture Abnormal T Waves: Differentiating Pericarditis from Myocardial Infarction (MI) by Joseph Alpert, MD is from the course Electrocardiogram (ECG) Interpretation. It contains the following chapters:
- Evolution of ECG Changes during an Acute MI
- Pericarditis
- Abnormal T Waves
Included Quiz Questions
Which of the following is false regarding the evolution of T waves during an acute MI?
- T wave normalization does not occur after an MI.
- Initially, there is a hyperacute elevated T wave.
- There is ST elevation.
- There is T wave inversion.
- There is ST elevation improvement.
Which of the following is true of monitor leads?
- Monitor leads can change with a patient’s position.
- Monitor leads can be used to draw conclusions about ST elevation.
- Monitor leads can be used to draw conclusions about ST depression.
- Monitor leads can be used to draw conclusions about QRS morphology.
- Monitor leads can be used to draw conclusions about ST segment morphology.
Which of the following statements about T waves is false?
- They are typically upright in aVR.
- They are typically upright in V3–V6.
- They are typically upright in leads I and II.
- Inverted T waves could be indicative of metabolic abnormalities.
- Inverted T waves could be indicative of stroke.
Author of lecture Abnormal T Waves: Differentiating Pericarditis from Myocardial Infarction (MI)

Joseph Alpert, MD
Customer reviews
5,0 of 5 stars
| 5 Stars |
|
5 |
| 4 Stars |
|
0 |
| 3 Stars |
|
0 |
| 2 Stars |
|
0 |
| 1 Star |
|
0 |
