Playlist
Show Playlist
Hide Playlist
Systematic ECG Interpretation

-
Slides Learning to Read an ECG.pdf
-
Download Lecture Overview
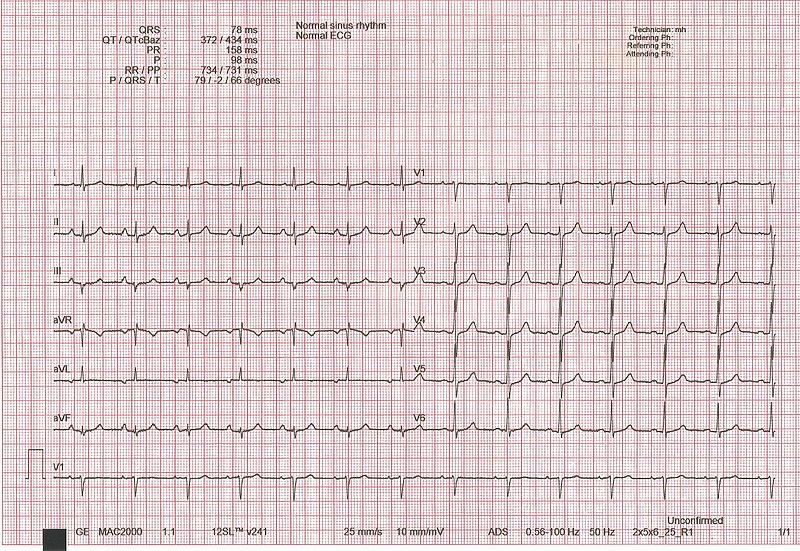
00:01 So, let’s start with the most basic way of interpreting the ECG. 00:05 The first thing you do is you have to check the voltage calibration. What’s this about? This is about the amplification of the image that the ECG machine is going. 00:16 Sometimes, with arrhythmias, we wanna enlarge the complexes, so, we will double the amplification of the image. 00:23 But usually, for almost all routine ECGs, the calibration is so called 10 millimeters, that’s 10 little boxes and we’ll show you examples of that and it’s always good to check that to begin with because if they had been using the machine at a higher amplification, the complexes are gonna look bizarre. 00:42 They’re gonna be big and so forth and you might make a mistake in readings. 00:45 So, first, make sure that the calibration is correct. 00:48 Usually, the technician takes care of that but there’s a little box that shows you the calibration’s okay and I’ll point that out later. 00:56 The next thing is to determine the rhythm and how do you do that? You’re looking for P waves followed by QRSs, in other words, the normal progression, remember, starting up with the sinus node, atrial depolarization, P wave, QRS, ventricular depolarization, T wave, resetting. 01:13 Once you know what the rhythm is, in other words, is this a normal sinus rhythm or is it not normal sinus rhythm but an arrhythmia and we’re gonna have whole lectures about the kinds of abnormal electrical events that can occur when it’s not sinus rhythm. 01:28 You then calculate the heartrate which is a -- there's a normals there and I’m gonna be going over the normals as we go along. 01:35 You then do the timing intervals, what’s the PR interval from the beginning of the P wave to the beginning of the QRS. 01:42 What’s the QRS duration? That’s the period of ventricular depolarization and then, how long does it take for the whole contraction and resetting of the ventricle from the Q wave to the end of the T wave. 01:55 We would then determine the electrical axis. In other words, what is the main vector force of the electrical depolarization wave, what direction is it going in? And there’s a certain normal area for that. 02:10 And for example, if you have abnormalities of ventricular mass, you can get abnormal vectors, abnormal electrical vectors. 02:21 We wanna look at the P wave morphology to see if it’s normal. 02:24 We look at its voltage and its shape because certain abnormalities of the P wave morphology can occur with certain diseases. 02:32 We wanna do the same for the QRS morphology. 02:35 Again, certain diseases and for example, heart blocks, things that can lead to pacemakers will change the morphology of the QRS. 02:44 We’ll then look at the ST segment and the T wave morphology, ischemia, lack of blood flow in the heart that can lead to angina or heart attacks, changes the ST segment and T wave morphology and if we’re lucky enough to have an earlier baseline EKG, we compare it to see, “Hey, have there been changes? Is something going on here that’s something acute?” So, let’s start. Here is a normal ECG. Notice in the upper left corner, there is a little green box. 03:14 That’s the standard and that standard is if you count the little tiny boxes, 10 little boxes. 03:21 Each one of the big boxes has five smaller boxes, so, there’ll be two of the big boxes which constitute 10 small boxes. 03:30 Each one of those boxes is one millimeter and corresponds to one millivolt of electrical activity. 03:37 So, again, this is the standard on all ECG machines. 03:43 And if you had set the standard to half, then, of course, it would be each one of those little boxes would be less voltage. 03:54 If you doubled it, they would be more voltage. But usually, again, almost all EKGs use this green box of the 10 standards. 04:03 You’ll notice how the leads are placed here. 04:06 On the left-hand side, there’s lead 1, 2, and 3. 04:10 Remember, zero degree, +60, +120. 04:14 The next three leads, aVR, L, and F, aVR +210, aVL -30, aVF +90, and then, come the precordial leads, the ones that are sticking through the heart like needles in a sagittal plane. V1, V2, V3, 4, 5, and 6. 04:32 And this is a normal ECG. Notice there’s a P wave in front of each QRS. The QRSs are nice and narrow. 04:40 There’s a nice T wave upright and not way prolonged after each QRS. 04:46 This is sinus rhythm, normal sinus rhythm that’s set off by the sinus node, passes normally through the heart. 04:55 There’s no evidence here of ischemia, or heart attack, or hypertrophy of the heart muscle. 05:00 As I said, you’ll notice that there’s sinus rhythm. In the green box, you’ll see that each QRS is preceded by a P wave. 05:08 The atrium depolarizes before the ventricle. All the P waves are followed by a QRS. 05:14 There’s no blockage of the beat as it goes down through the heart. 05:18 Each QRS is preceded by a P and the Ps are all identical, they’re upright in leads two and aVF and they’re nice and narrow, they’re not prolonged. 05:29 If any of the comments just made the answer was no, then, you’re talking about an arrhythmia and as I said, we’re gonna have whole lectures on the arrhythmias later, so, right now, we’re just worrying about the normal. 05:41 Also, you noticed how nicely the QRSs progress. 05:47 In fact, that whole strip along the bottom, even though they’re different leads, it’s continuous, so, you’re actually seeing one set of P waves after another. 05:58 In order to obtain the heartrate, you count the number of big boxes between two QRSs and you divide into 300. 06:06 So two big boxes divided into 300 equals a heart rate of 150. 06:12 If there were three big boxes in between a QRS, that would be a rate of 100, three into 300. 06:18 If there were four boxes in between the two QRSs, that would be 75, four into 300 is 75. 06:25 You can also do it by counting the number of QRSs in three seconds. 06:30 Remember, the ECG is moving at a certain rate. 06:32 You can calculate a number of seconds and then, multiply by 20 but usually, what we do is we use the rule of 300 mentioned before. 06:41 It’s important to note that the normal heartbeat is 60 to 100 beats per minute. 06:49 So, now, we have a heartrate, by the way, the computer’s almost always right on the heartrate. 06:55 Again, let’s talk about the intervals. 06:58 So, a normal PR interval is 0.12 seconds to 0.20 seconds, that’s three little boxes to five little boxes, alright? You remember there’s five little boxes within the bigger box. 07:11 So, the normal PR interval from the beginning of the P wave to the beginning of the QRS is somewhere between three and five little boxes, 0.12 to 0.20 seconds. 07:22 The normal QRS interval is less than 0.10, that’s two and a half little boxes and the normal QT which is corrected for heartrate in a formula is somewhere between 0.30 and 0.46 seconds. 07:37 Remember the QT from the beginning of the Q wave to the end of the T wave. 07:42 Remember, each small box is 0.04 seconds, so a large box is five times 0.04 seconds or 0.20 seconds and there are five small boxes in each large box as I’ve said before. 07:57 Again, what about the axis? Well, there’s the general rule that most med students use and that is if the QRS is upright in leads one and two, it’s a normal axis. 08:10 You can actually calculate the axis because the axis is perpendicular to any lead where the R and the S or the upstroke and the down stroke are equal. In this example, lead 3 you see that pretty much the amount above the line and below the line is about the same. 08:27 So, the axis is going to be 90 degrees from lead 3. So, 90 degrees plus 120, lead 3 is 120. 08:35 Remember, that’s 210 and that would be in other words, the axis would be towards AVR or -90 from 120 would be 30, that would be somewhere near lead two which is +60. 08:48 Well, you can see how do we tell? Where is the maximum R wave? Well, the maximum R wave is around lead two. 08:55 There’s no upright R wave in aVR, so, therefore, the axis is actually something like a +30. 09:04 So, again, the rule of thumb is you look to see where the amount of voltage up and down is equal. 09:11 The axis is 90 degrees from that, then, you look for the lead with the maximum R wave, that’s the direction because you could go this way on the 90 degrees or you could go that way. 09:22 What tells you which way you go is, where’s the maximum R wave? in this one, it’s lead two. 09:28 And again, normal axis is between -30 and +90. 09:33 And if the axis is not between -30 and +90, then, it’s an axis deviation. 09:40 If it goes more minus, that’s so-called left axis deviation, if it goes more plus than 90, it’s called right axis deviation. 09:48 And we’ll talk about how that’s used in reading various electrocardiographic diagnosis. 09:54 So, again, just to reiterate, the axis for the mean frontal plane electrical vector of the heart is near the limb lead with the tallest R wave and perpendicular to the lead where the size of the upward deflection and the downward deflection are equal. 10:10 Remember, the upward deflections called an R wave, the downward deflection is called an S wave. 10:16 So, let’s take a look at the P wave itself. 10:19 The normal P wave is going to be three little boxes or less in duration. 10:25 Remember that the PR interval, that’s the duration from the beginning of the P wave to the beginning of the QRS is going to be less than five little boxes. 10:33 But the length of the P wave itself should be only three little boxes. 10:38 And it should be upright in lead one and two and a negative deflection of less than one box wide or one box deep in V1. 10:49 If the P wave in lead V1 is more negative than one box and wider than one box, that suggests that the atrium is - the left atrium is enlarged, so called left atrial enlargement. 11:05 If the box is pointed and higher than two millimeters, then, and usually wider than two, then, that defines right atrial enlargement. Now, these numbers are not anatomically perfect. 11:22 The echo and the MRI are so forth will be more perfect but they carry prognostic information. 11:28 They’re very important because when they appear, it really means that there’s quite significant either left atrial dilatation or right atrial dilatation. 11:36 Let’s look at the R wave now. 11:39 The normal R wave should transit in the precordial lead starting with lead V1, there should be a very small R wave and then, it gets a little bigger in V2 and somewhere between V3 and V4, you have a dominant R wave with not much S wave and then, it progresses out to V6 with usually the maximum R wave somewhere in V4, 5, and 6 with the transition from more negative to positive somewhere around V3 or V4. 12:10 Small Qs that is initial downward deflections of less than one title box can occur but they are never longer than one box. 12:21 If they’re wider than one box, it suggests that there’s been damage to the myocardium. 12:26 And the voltage should be within a normal range. 12:31 Also, the ST segment should be isoelectric, that is it should be flat. 12:36 You can have a little bit of depression but if it’s substantially depressed more than a tiny amount, it suggests a number of things. Let’s look at what it suggests. 12:47 If there’s a sort of curved sagging of the ST segment as in this example, that means the patient is usually taking digitalis, digitalis has that effect. 12:56 If there’s ischemia or lack of blood flow, you see a squared off flattening of the ST segment. 13:02 We see that with a positive exercise test and we see that when patients come in and have so called non-ST elevation myocardial infarct and we’ll talk more about those definitions later. 13:14 And then, in hypokalemia where the potassium is low, you may see a mildly down sloping ST segment. 13:21 The T wave is often flattened and as I mentioned before, you may see a little additional wave after the T wave, the U wave. 13:28 Again, here’s the normal EKG. Look at the ST segments here, they’re all fine. 13:35 They’re not depressed, they’re not elevated, they’re in exactly the right sequence.
About the Lecture
The lecture Systematic ECG Interpretation by Joseph Alpert, MD is from the course Electrocardiogram (ECG) Interpretation.
Included Quiz Questions
Interpreting an ECG requires a systematic approach. Which of the following would not be included in such an approach?
- Avoiding comparison with prior tracings
- Checking the voltage calibration
- Determining the rhythm
- Calculating the heart rate
- Determining the timing intervals
The standard voltage calibration is such that 10 mm is equal to how many mV?
- 1.0 mV
- 0.5 mV
- 10.0 mV
- 0.2 mV
- 2.0 mV
Which of the following is the most appropriate way to ascertain the heart rate on an ECG?
- Counting the big boxes between 2 QRS complexes and dividing 300 by that number
- Counting the little boxes between 2 QRS complexes and dividing 300 by that number
- Counting the big boxes between 2 QRS complexes and diving 150 by that number
- Counting the big boxes between 2 QRS complexes and diving 600 by that number
- Counting the little boxes between 2 QRS complexes and diving 1,000 by that number
On an ECG, how many seconds does each small box represent?
- 0.04 seconds
- 0.40 seconds
- 0.20 seconds
- 0.02 seconds
- 1.00 seconds
On an ECG, how many seconds does each large box represent?
- 0.20 seconds
- 0.04 seconds
- 1.00 seconds
- 0.50 seconds
- 0.06 seconds
On an ECG, how many small boxes are in each large box?
- 5
- 4
- 6
- 8
- 10
On an ECG, what is the range, in degrees, of a normal axis?
- Between –30° and 90°
- Greater than 45°
- Between 30° and 90°
- Between –90° and 30°
- Less than 45°
Author of lecture Systematic ECG Interpretation

Joseph Alpert, MD
Customer reviews
5,0 of 5 stars
| 5 Stars |
|
2 |
| 4 Stars |
|
0 |
| 3 Stars |
|
0 |
| 2 Stars |
|
0 |
| 1 Star |
|
0 |
Great, very significant knowledge. Definitely will recommend to my colleagues
Straight forward, clear and easily applicable! Basis of every ECG interpretation.
