Playlist
Show Playlist
Hide Playlist
Population Pyramid – Descriptive Epidemiology


-
Slides 09 DescriptiveEpidemiology Epidemiology.pdf
-
Download Lecture Overview
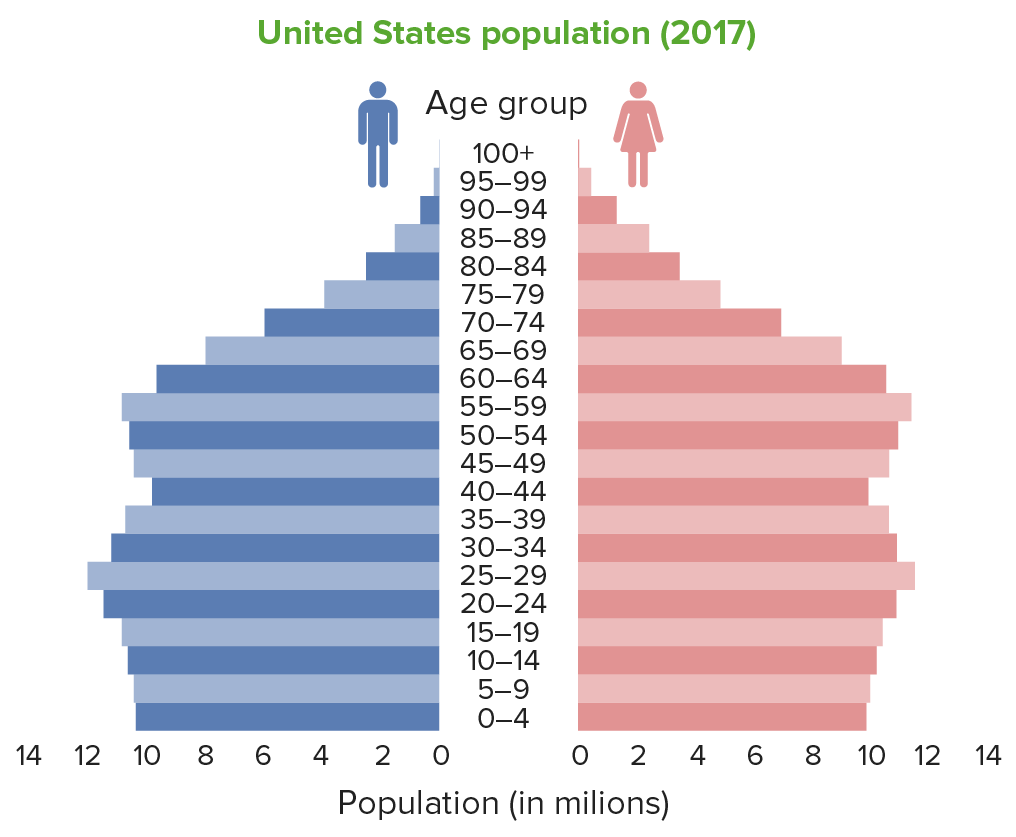
00:00 Now let's switch gears a bit and talk about population pyramids. I like population pyramids a lot, they are an easy visual way of understanding the distribution of ages in a given population and age tells us a lot about the probable trajectory of a population towards disease states. The way a population pyramid is set up, is on the vertical axis we have the categories of age in a population and on the horizontal axis we have the numbers of people in those particular age groups. We tend to divide it by sex as well; so on one side will be men and the other side women. Let's look at an example. This is Bahrain in 2012. This is a fascinating distribution, in Bahrain we can see that there is mostly men in the population and that difference in men and women really is exemplified around the 30 to 40 year range. 00:53 We also see that Bahrain seems to be a mostly young population, the majority of people are under 40 years of age, we have very few numbers of people over 70. Compare that to Japan; Japan is one of the oldest countries in the world in terms of its age distribution. We see that the numbers of men and women are fairly equivalent, but most people seem to be over 40, so that makes it an old population. 01:19 Now let's talk about absolute versus pure measurements. So far when we talk about ratios and rates, those are relative measurements, so absolutes are pure quantities and relative measures are rates or ratios, it's important to get these straight in your mind, especially when you're reading the newspaper or reports on diseases, very often we report on relative rates, when in fact sometimes it's more important to think about the absolute rates and vice versa. So this is an intellectual exercise, it requires a human touch to understand which is the important information that's being expressed. Here is an example. The prevalence of cholera in a community might double from one year to the next. That's a relative measure. 02:02 Doubling is when we divide what we have this year by what we had next year, but that might only reflect a change of two cases to four cases, or three cases to six cases. That's an instance of doubling, but the actual numbers, 2, 4, 3, 6, that's quite low. So keep in mind when we talk about relative measures, we have to take that extra step and investigate what the numbers are actually based on.
About the Lecture
The lecture Population Pyramid – Descriptive Epidemiology by Raywat Deonandan, PhD is from the course Descriptive Epidemiology.
Included Quiz Questions
What does the horizontal axis in a population pyramid represent?
- The number of people
- The number of healthy people
- The number of people with a disease
- The number of women
- The number of young adults
Author of lecture Population Pyramid – Descriptive Epidemiology

Raywat Deonandan, PhD
Customer reviews
5,0 of 5 stars
| 5 Stars |
|
5 |
| 4 Stars |
|
0 |
| 3 Stars |
|
0 |
| 2 Stars |
|
0 |
| 1 Star |
|
0 |
