Playlist
Show Playlist
Hide Playlist
Aortic Stenosis: Visualization

-
Slides ValvularHeart DiseaseAorticStenosis CardiovascularPathology.pdf
-
Download Lecture Overview
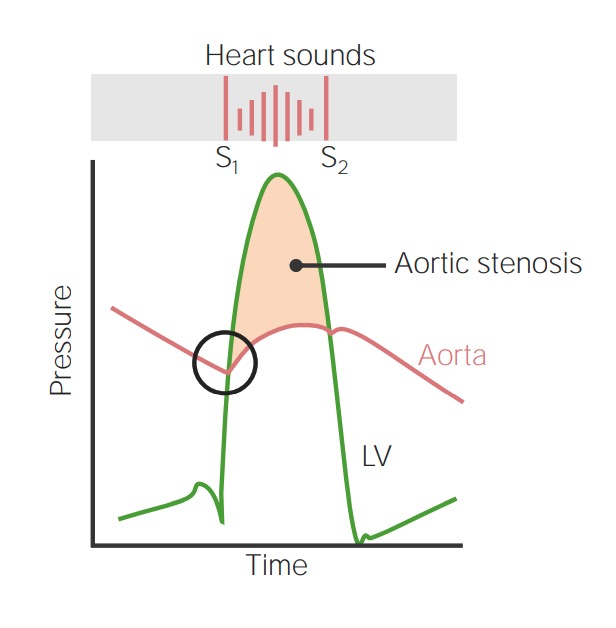
00:00 Alright, now, speaking of which, how important is this? Really important clinically and these are pictures that you're seeing over and over again, but the number of things that we can walk you through here. Let us begin. First and foremost, I want you to take a look at the picture in which we find left ventricular pressure, that green line and then you comparing this to the red line, which is the aortic pressure. At that first point, where we have just completed diastole, at the bottom of the valley and then you are moving up that curve, what is that called? Isovolumetric contraction, isn't it? Of what? The left ventricle . And the left ventricle is building up pressure. Would you tell me how much blood is in your left ventricle right now? It is the fullest that it can be. And it is building enough pressures so that it can do what? Open up the aortic valve. That is my problem and on a question they can actually put A, B, C, D, E on this graph and ask you where is not pathology located for aortic stenosis? It would be at that point where the green line intersects with that aortic pressure and is trying to open up, but it can't. So what does the left ventricle have to do? It has to continue building that pressure. How is that represent? You see that shade underneath that curve that peachish shade, that's a pretty color, isn't it? The peachish shade that you see underneath that curve represents the increased pressure of the left ventricle lifting up weights so that it can overcome the afterload of the stenotic aortic valve. Is that clear? How are you going to represent this? Well here is S1 and there is S2. You see them. Now S1 is going to represent what? Closure of the mitral valve. S1 is never opening. Actually, no heart sound is created by opening. Is that clear? We have talked about that a few times now. So where is my mitral valve closing? At the bottom of that valley. At the end of your diastole, right before you begin isovolumetric contraction. And so therefore when the mitral valve closes, you're building pressure, crescendo. Aortic valve opens, decrescendo. 02:26 It is a diamond in the rough. That is a diamond between S1 and S2, the crescendo decresdendo the type of murmur. Welcome to aortic stenosis. How is the patient feeling? Tell me. Tired, fatigued. Now you guys feel motivated right now. You want to learn more. Your are thirsty for knowledge. Let us continue. So you have crescendo decrescendo type of murmur. 02:48 Next, let us take a look at the pressure-volume loop. Well we will take a look at two here. 02:55 One is going to be the blue curve. You see that solid blue curve and that is going to be normal. Listen to what I am saying. That solid blue curve represents normal pressure-volume loop. Now with that, you begin at a point where it is a diastole. The X-axis represents volume and the Y-axis represents pressure. 03:17 to be pressure and so now you begin increasing volume. You increase your volume, what do you do now? You close your mitral valve and you move up the Y-axis, which means what? You increase the pressure. You see that. Now this is the pressure-volume loop that you also comfortable with and the blue line represents normal and you move up that pressure and eventually you will open up that aortic valve. When you open up the aortic valve, you go directly into what is known as your rapid ejection. Which way are you following the pressure-volume loop? You are following with counterclockwise, not clockwise. That must be understood. So that is the only way that you get this right. I want you to compare that point where aortic valve should open and compare that to the dash line. That dash line continues to increase pressure, why? Because the aortic valve doesn't want to open. Is that clear? So any time that you find a curve in which it is much more increased in pressure compared to normal, then that you automatically should mean what? Aortic stenosis and now I may ask you something. If that aortic valve doesn't want to open and by the time you finally do,then would you tell me what is stroke volume equals. Close your eyes. Stroke volume equals, when is your heart or ventricle the fullest, at the end of diastole or end of systole? Take your time. You got this. At the end of diastole is when the left ventricle is the fullest, isn't it? From this, you subtract your end systolic volume. What is that going to give you? Stroke volume. Is that clear? So how does that represent? On the pressure-volume loop, the area between the curve or area underneath the curve represents the stroke volume. So now in aortic stenosis, how do you open up the aortic valve, systole. 05:15 As you open up that aortic valve and once you do so, the blood is being ejected. How much blood is left at the end of systole? It is the least that your left ventricle contains. 05:26 In aortic stenosis when the aortic valve doesn't want to open, then at the end of systole, how much more blood you have left in your left ventricle? A little bit more. You see that dash curve and so when you follow it with kind of clockwise, you will notice that end systolic volume is actually increased. Is that clear? When your end systolic volume is increased and in the equation where stroke your end systolic volume, with an increase in end-systolic volume, what have you done to stroke volume? You have decreased it. These are types of questions that you are going to get integrated with pathology and physiology. If you're weak these particular areas, I would highly recommend you go back and take a look at your physio so that you are perfectly clear with every single one of this clinical points. We must continue. 06:21 Aortic stenosis, pathophys. As the valve area decreases, the left ventricle must work harder. What is the left ventricle going to do? Increase thickness. It is going to increase the demand for oxygen. It could or could not be met. If it is not met, then we have issues with what is called as angina. And in response to the increased workload, what kind of effect is the left ventricle undergoing? Hypertrophy. What kind of hypertrophy is this? It is the fact that sarcomeres are going to do duplicate in parallel. It is called concentric hypertrophy. Take a look at these hearts. It shows exactly that when you are walking through this. You see the normal heart. You see where is LV, left ventricle. That is the normal left ventricle. "But Dr. Raj, it looks thickened." Yes. It is supposed to be, normally. Left ventricle has a heck of a lot of responsibility of supplying blood to the entire body. And so therefore it has to have increased pressure, 120/80. You know that right. Now I want you to compare the thickness of left ventricle of normal versus which you are seeing here with concentric hypertrophy. Concentric hypertrophy, you have increased thickness. 07:31 What caused that? Increased pressure. In this case, by whom? Aortic stenosis. The left ventricle was lifting weights and it underwent hypertrophy. You tell me once again, what happens to stroke volume here with the aortic stenosis. It decreases. Why? Because of increased end systolic volume. Why? Because at the end of systole, there is more blood left in left ventricle because of that stenotic aortic valve. Is that clear? Make sure it is before you move on. Or otherwise you want to make sure you solidify that point forever more before take a look at any other issues. Now in terms of concentric hypertrophy that is exactly what we just talked about, that bigger left ventricle.
About the Lecture
The lecture Aortic Stenosis: Visualization by Carlo Raj, MD is from the course Valvular Heart Disease: Basic Principles with Carlo Raj.
Included Quiz Questions
Which of the following pathophysiological changes is found in a patient with aortic stenosis?
- Increased end systolic volume
- Increased stroke volume
- Increased cardiac output
- Decreased end systolic volume
- Decreased heart rate
Which of the following changes does the heart undergo in response to aortic stenosis?
- Concentric hypertrophy of the left ventricle
- Eccentric hypertrophy of the left ventricle
- Concentric atrophy of the left ventricle
- Atrophy of the left ventricle
- Concentric hypertrophy of the right ventricle
Which of the following is not an etiology for the decreased stroke volume in aortic stenosis?
- Delayed closure of the atrioventricular valve
- Decreased left ventricular chamber size
- Delayed opening of the aortic valve
- Elevated end-systolic volume of the left ventricle
- Increased left ventricular pressure
Which phase of the pressure-volume curve of the left ventricle precedes the opening of the aortic valve?
- Isovolumetric contraction
- Isovolumetric relaxation
- Mitral valve closure
- Opening of the pulmonic valve
- Systolic ejection
Author of lecture Aortic Stenosis: Visualization

Carlo Raj, MD
Customer reviews
5,0 of 5 stars
| 5 Stars |
|
2 |
| 4 Stars |
|
0 |
| 3 Stars |
|
0 |
| 2 Stars |
|
0 |
| 1 Star |
|
0 |
I am so happy Dr Raj did tis with Lecturio, he goes over everything and answers the why. He makes the lectures very in-depth and relatable to step 1. After listening to him I don't have to seek any other resource to solidify my step one concept. Totally wish the Anatomy, physiology, Biochem lectures would go more inept and integrated for step 1 students like Dr Raj does.
easy grasp, well laid out and proper delivery for passing the step 2ck exams.
