Playlist
Show Playlist
Hide Playlist
Cardiac Arrhythmia: Review

-
Slides CardiacArrythmia CardiovascularPathology.pdf
-
Download Lecture Overview
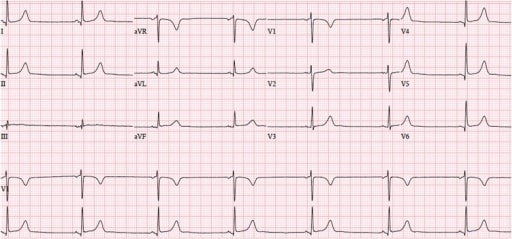
00:00 Let's continue. 00:02 So we have here quickly is an EKG. 00:05 I'm going to show you what components of this EKG would be the most important so that you can interpret it properly. 00:12 Ready? Now, we have the x-axis and y-axis. 00:15 X-axis is what we're going to be paying attention to, is that clear? The x-axis, it represents or will show you the different types of waves, either positive deflection and negative deflection. 00:27 Before we go on, I wish for you to take a look at a little bit of math up above, so that you clearly see as to the difference between a little box and a big box, okay. 00:37 A little box and a big box. 00:40 A little box is 1 millimeter. It represents 0.04. 00:45 Memorize that if you haven't already. 00:47 You see that little box right there. That little box represents 0.04. 00:51 So in from henceforth, whenever I talk about little box, I'm talking about 0.04. Is that clear? A big box is five little boxes. 01:03 Okay, so a big box is five little boxes can I be anymore dramatic. 01:08 So if you take five of those little boxes, what is your time? Take a look. 01:14 0.2 seconds. Is that clear? And that you want to memorize. 01:19 So so far, a little box 0.04, a big box is 0.2 Why is that important? I want you to take that math that we just did, please. 01:29 And I want you to come down. 01:31 And do you see where it says PR interval. 01:33 I need you to memorize if you haven't already, that that PR interval, the maximum amount of time, normally speaking that a PR interval should exist is 0.2 seconds maximum. 01:45 What's the minimum? Is 0.12. 01:48 Okay, so if you take a look at the PR interval, what is the PR interval? The PR interval are the beginnings. 01:55 What does that mean Dr. Raj? The PR intervals are the beginning of the P wave to the beginning of the QRS complex. Is that clear? The PR interval represents what in your head? The PR interval, your thinking represents the time that it requires and impulses to begin at the SA node making its way down to the AV node. 02:17 Is that clear? Why is that important? Well, we could talk about how if your time of your PR interval is greater than how much? 0.2 seconds which is the maximum time, you got a problem. 02:31 Is that a WPW? Or is that going to be AV nodal blocks? Do you see how we've taken the math that at some point, maybe it frustrated you and even thought to yourself, "Why do I need to know this?" I'm telling you why right here, clinical application, So, if you find your 0.2 seconds to be greater for your PR interval then that is obviously AV nodal block, right? Because things are slowing down. 02:55 And we'll talk about that upcoming. 02:57 Whereas, if it's less than 0.12 seconds, that brings us to a very, very, well, important diagnosis known as WPW now, that's only one component. 03:07 But do you see as to how that time becomes very important for us? And how the little box and the big box will play huge roles. 03:14 Let's continue on our x x, the P wave we all know means originating ever SA node that took the activity you tell me and we mentioned this a bunch of times, what goes to the heart first? Electrical activity for by the mechanical activity. 03:31 What is the P wave represent for mechanical activity? The A wave. 03:37 Are you seeing it? Take a second. 03:40 Okay, you saw it in your head. 03:42 P wave represents A wave. 03:44 A wave represents atrial kick. Correct? That's a mechanical activity. 03:48 What's that part of again? One more time? Late diastole. 03:51 Good. Let's continue. 03:53 So now we have our QRS complex. 03:54 We just discussed pure interval. 03:57 That QRS complex represents all, all while not excuse me strictly represents only the ventricle depolarization. 04:05 All it represents is ventricular depolarization. 04:08 Now, if you're talking about ventricular depolarization, then what are we referring to? Thats the fact that we have remember an actual potential way back basic concepts of physiology for cardiology. 04:20 It's the fact that you have 0, 1, 2, 3, 4 Okay, 0, 1, 2, 3, 4. 04:24 You tell me with phases 0, 1, 2, 3, 4, which one of those represents a ventricular depolarization. 04:32 It is obviously phase zero, right? Phase zero. 04:36 What is phase zero mean to you? So I'm really, I'm really, having you review your basics right now. 04:44 So that phase zero, and how important is this? Really important. 04:48 Alright, so if you're not good with this, I highly recommend that you go back and take a look at your action potentials for the heart. 04:55 And here specifically, I am doing my mechanical activity. 04:58 Okay. 04:59 Why is this important? In a little bit, in a lecture series, we'll go into antiarrhythmias. 05:04 And if you haven't understood this, things are getting complicated. 05:08 I don't want you to get frustrated. 05:09 It's about really building upon your information. 05:12 Okay, so that voltage-gated sodium channels what that is at phase zero is a voltage-gated sodium channel, isn't it? and you have an MNH gate and giving you more detail stuff that you already should know. 05:22 So that phase zero is your voltage-gated sodium channel. 05:26 It represents ventricular depolarization. 05:28 How's that represented on your EKG? QRS complex. 05:31 We will go as far as that right now. 05:34 We'll go into further detail as we go into phase one, phase two, which is plateau, and phase three. 05:42 Right now, we're focusing upon phase zero, voltage-gated sodium channel. 05:46 It has an activation gate and inactivation gate. 05:49 This is represented on your EKG by the QRS complex ventricular depolarization Now, let's move on to the next portion. 05:57 The all important ST segment. 06:00 The ST segment a bunch of things we've talked about. 06:03 If I told you non-STEMI, non-ST-elevation myocardial infarction, give me some differentials, please. 06:10 If all that you see in a stem of a question, or an attending tells you, "Son, or daughter, tell me about non-STEMIs." You're going to step up to the plate, and you're going to tell them what? You're gonna say, maybe just maybe there is subendocardial type of myocardial infarction, What kind? Subendocardial myocardial infarction or this was a angina? Correct? What kind of angina, is the attending asking you? You're not going to tell the patient vaso, or not gonna tell the attending that it's vasospastic angina. 06:42 More likely, you're referring to stable or perhaps unstable angina. 06:48 Right? And there you had ST depressions. 06:51 You had ST depressions, those were your non-STEMIs. Is that clear? What if it was ST Elevations? About ST elevations, the differentials would be transmural type of myocardial infarction, or maybe vasospastic. 07:06 Now that attending or licensing exam is asking you, "Well, how can you distinguish? How can you confirm? You're looking for cardiac enzymes. 07:14 Cardiac enzymes are present, then you know your patient for sure had some type of myocardial infarction. 07:19 If not, then your differentials are a little bit more. 07:23 So ST segment, we spent a lot of time there, you know that normally, it should be isoelectric. 07:28 And then we have the T wave. 07:30 Let me about that T wave. 07:31 Well, that T wave represents a ventricular repolarization. 07:35 So a ventricular repolarization, that you tell me if you're referring to actual potential, and this could be a tricky question, if you haven't properly studied, if you haven't properly understood your pathophysiology. 07:49 The T wave represents ventricular repolarization. 07:53 If it's an actual potential of mechanical type that I'm referring to, meaning phase 0, 1, 2, 3, 4, you tell me what phase of the action potential is represented by your T wave. 08:06 Phase zero, we already talked about what's QRS depolarization. 08:10 Phase two is plateau. That's your calcium influx. 08:13 And that actually is your ST segment. 08:15 Is that clear? How can you remember that? Plateau, phase two. 08:19 ST segment, flat. 08:21 Here is phase three. 08:23 Have you ever put that into context? I hope you have. 08:26 Because, you know, this is a beautiful thing. 08:29 So if that potassium is effluxing during phase three, Isn't that repolarization? Of course it is. 08:36 So that is your T wave. Wonderful. 08:40 Finally, we have a QT. 08:42 That's important, isn't it? Why? I just got done talking to you about torsades de pointes. 08:48 What did I say was a predisposing factor to torsades de pointes. 08:52 It was a prolonged QT interval. 08:55 So if that QT interval was prolonged, what caused it? Maybe drugs, more commonly. 09:00 Antiarrhythmic, such as your sodium channel blockers class one, or maybe it was antibiotics, maybe antipsychotic so on and so forth. 09:07 Then also inherent, such as Romano–Ward, Lange-Nielsen and such. 09:14 Well, if you have a prolonged QT interval, you're predisposed to torsades de pointes. 09:18 These are some of the most important points of this EKG, You're paying attention to x-axis. 09:24 Everything that I just went through here is just to give you clinical application in the subsequent lecture series. 09:31 We will dive into details further further and further. 09:35 But it all begins with knowing the foundation.
About the Lecture
The lecture Cardiac Arrhythmia: Review by Carlo Raj, MD is from the course Arrhythmias: Basic Principles with Carlo Raj.
Included Quiz Questions
Which of the following is a risk factor for Torsade de Pointes?
- Prolonged QT interval
- Supraventricular arrhythmia
- Peaked T wave
- ST-segment depression
- ST-segment elevation
What is the characteristic ECG finding in atrial flutter?
- Sawtooth appearance
- Loss of P waves
- At least 3 different p wave morphologies.
- Biphasic p wave
- Enlarged (tall and wide) P wave
What is the characteristic ECG finding in multifocal atrial tachycardia?
- At least 3 different p wave morphologies.
- Biphasic p wave
- Enlarged (tall and wide) P wave
- Loss of p waves
- Sawtooth appearance
What does the P wave on the ECG represent?
- Atrial contraction
- Opening of the AV valves
- It represents systole.
- Electrical activity originating in the AV node
- Ventricular contraction
Which of the following ECG segments corresponds with phase 0 of the ventricular action potential?
- QRS complex
- P wave
- PR interval
- QT interval
- ST segment
Author of lecture Cardiac Arrhythmia: Review

Carlo Raj, MD
Customer reviews
5,0 of 5 stars
| 5 Stars |
|
1 |
| 4 Stars |
|
0 |
| 3 Stars |
|
0 |
| 2 Stars |
|
0 |
| 1 Star |
|
0 |
Dr. Raj lecture is filled with “dramatic expressions” that made understanding/memorizing information easier. Dr. Raj appears to be passionate about his work, making his lectures enjoyable.
