Playlist
Show Playlist
Hide Playlist
Acute Pericarditis: Diagnosis

-
Slides Disease of Acute Pericarditis.pdf
-
Download Lecture Overview
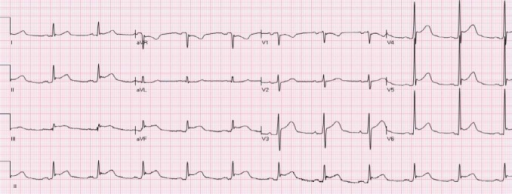
00:01 With acute pericarditis, there is a characteristic chest pain that is retrosternal, pleuritic hurts when the patient takes a breath, worse when lying flat, and relieved by sitting forward. Tachycardia and dyspnea may occur. A pericardial friction rub may be auscultated: It sounds like rubbing 2 pieces of leather together, and of course it will be timed to the beats of the heart, not to the respiratory rhythm. There may be a pericardial effusion, which may cause the pericardial friction rub to disappear. ST segment elevations will occur in most leads because the myocardial tissue will also be inflammed. In the first week, or Stage 1, of acute pericarditis, the ECG pattern typically shows concave ST elevations and PR depressions in almost all limb leads (I, II, III, aVL, aVF) and in the precordial leads (V2–6). Lead aVR will show reciprocal changes, with ST depression and PR elevation. You also might see these reciprocal changes in lead V1. There will be no pathological Q waves. Sinus tachycardia is commonly present because of pain, a pericardial effusion, or both. The ECG changes are similar to those of an acute myocardial infarction except that the ST elevations involve almost all leads. The aVR lead is reciprocal because it is “looking” at the electrical activity of the heart from the right shoulder perspective, whereas the other limb leads are “looking” at the heart from the opposite or nearly opposite point of view, ranging from the left shoulder to the right foot. This is diagrammed in the hexaxial reference system graphic on the slide, which is also known as the “Cabrera system,” showing the heart's electrical axis in the frontal plane. 01:42 The ECG changes classically pass through 4 stages over several weeks, but only half or fewer of the patients will show all these changes, and the pattern may not always follow this progression. Stage 1 occurs in the first to second week after onset, and this is where you will see ST elevations and PR depressions in almost all the leads, with reciprocal changes in aVR. Stage 2 can occur in the first to third week and is associated with normalizing of the ST segments while the T waves become flattened. Stage 3 occurs at the third week or later and shows inversion of the T waves. Finally, after several weeks, Stage 4 is reached, when the ECG returns to normal. 02:22 Echo, effusion. So half of your patients, you might actually find effusion taking place in your pericardial cavity. These are 2 ultrasound images of a pericardial effusion, as shown by the arrows. The image on the left shows the heart in the transverse section, and the image on the right is a longitudinal view. Here is a 12-lead electrocardiogram showing the typical changes of acute pericarditis in its initial stages, showing ST elevations in most leads and reciprocal changes in aVR. So, when you see this ECG pattern in a patient who has all the signs and symptoms of acute pericarditis, you can make the diagnosis.
About the Lecture
The lecture Acute Pericarditis: Diagnosis by Carlo Raj, MD is from the course Pericardial Disease: Basic Principles with Carlo Raj.
Included Quiz Questions
Which of the following ECG changes is NOT associated with acute pericarditis?
- Q waves
- ST-segment elevation in most leads
- PR depression in most leads
- PR elevation in lead aVR
- Normalization of the ST segments after the first week.
Which of the following is a sign or symptom of acute pericarditis?
- All of the above
- Leathery friction rub on auscultation
- Muffled heart sounds
- Pain is relieved by leaning forward
- Low grade fever
Author of lecture Acute Pericarditis: Diagnosis

Carlo Raj, MD
Customer reviews
5,0 of 5 stars
| 5 Stars |
|
5 |
| 4 Stars |
|
0 |
| 3 Stars |
|
0 |
| 2 Stars |
|
0 |
| 1 Star |
|
0 |
